MACD
What is the Moving Average Convergence Divergence (MACD)?
The Moving Average Convergence Divergence (MACD) is a trend-following momentum indicator that shows the relationship between two moving averages of a security's price. The MACD is calculated by subtracting the 26-period Exponential Moving Average (EMA) from the 12-period EMA, resulting in the MACD line. A 9-day EMA of the MACD, called the "signal line," is then plotted on top of the MACD line, which can function as a trigger for buy and sell signals.
ADD MACD INDICATOR

info
Search Moving Average Convergence Divergence in indicators
SET SOURCES

info
Select Source 1 : MACD: MACD
info
Select Source 2 : MACD: SIGNAL
RESULT
info
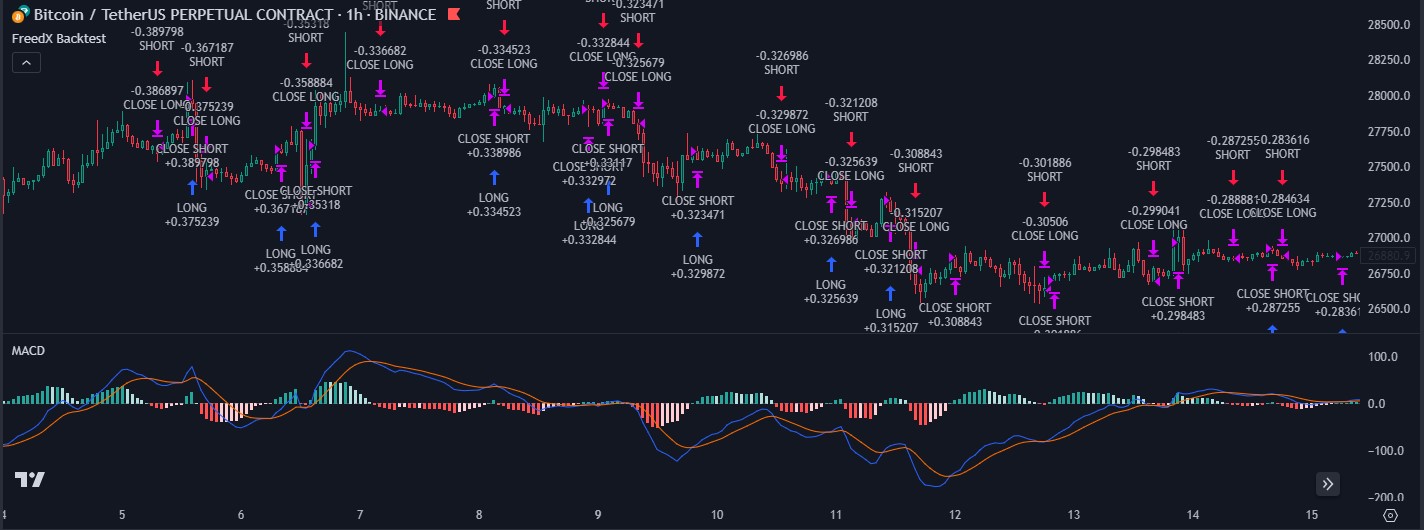
Example Backtest Chart